The Art of Debugging in Laravel: A Comprehensive Guide Link to heading
Debugging can feel like hunting for a needle in a haystack, especially when you’re deep into a Laravel project. Fear not, brave coder! Today, we embark on a journey to make debugging in Laravel an art form you can master. Whether you’re a novice or a seasoned developer, there’s always room to refine your debugging skills.
Why is Debugging Important? Link to heading
Debugging ensures the reliability and correctness of your code. In the words of Brian Kernighan, “Debugging is twice as hard as writing the code in the first place. Therefore, if you write the code as cleverly as possible, you are, by definition, not smart enough to debug it.” Hence, a systematic approach to debugging is crucial.
Laravel Debugging Tools Link to heading
Laravel provides several tools to help streamline the debugging process. Let’s dive into some of the most useful ones.
1. Laravel Debugbar Link to heading
Laravel Debugbar is an excellent package that provides a wealth of information about your application’s performance and queries.
Installation Link to heading
You can install it using Composer:
composer require barryvdh/laravel-debugbar --dev
Then, publish the configuration file:
php artisan vendor:publish --provider="Barryvdh\Debugbar\ServiceProvider"
Usage Link to heading
Once installed, the debug bar will appear on your application’s pages. It provides insights into queries, route information, and much more.

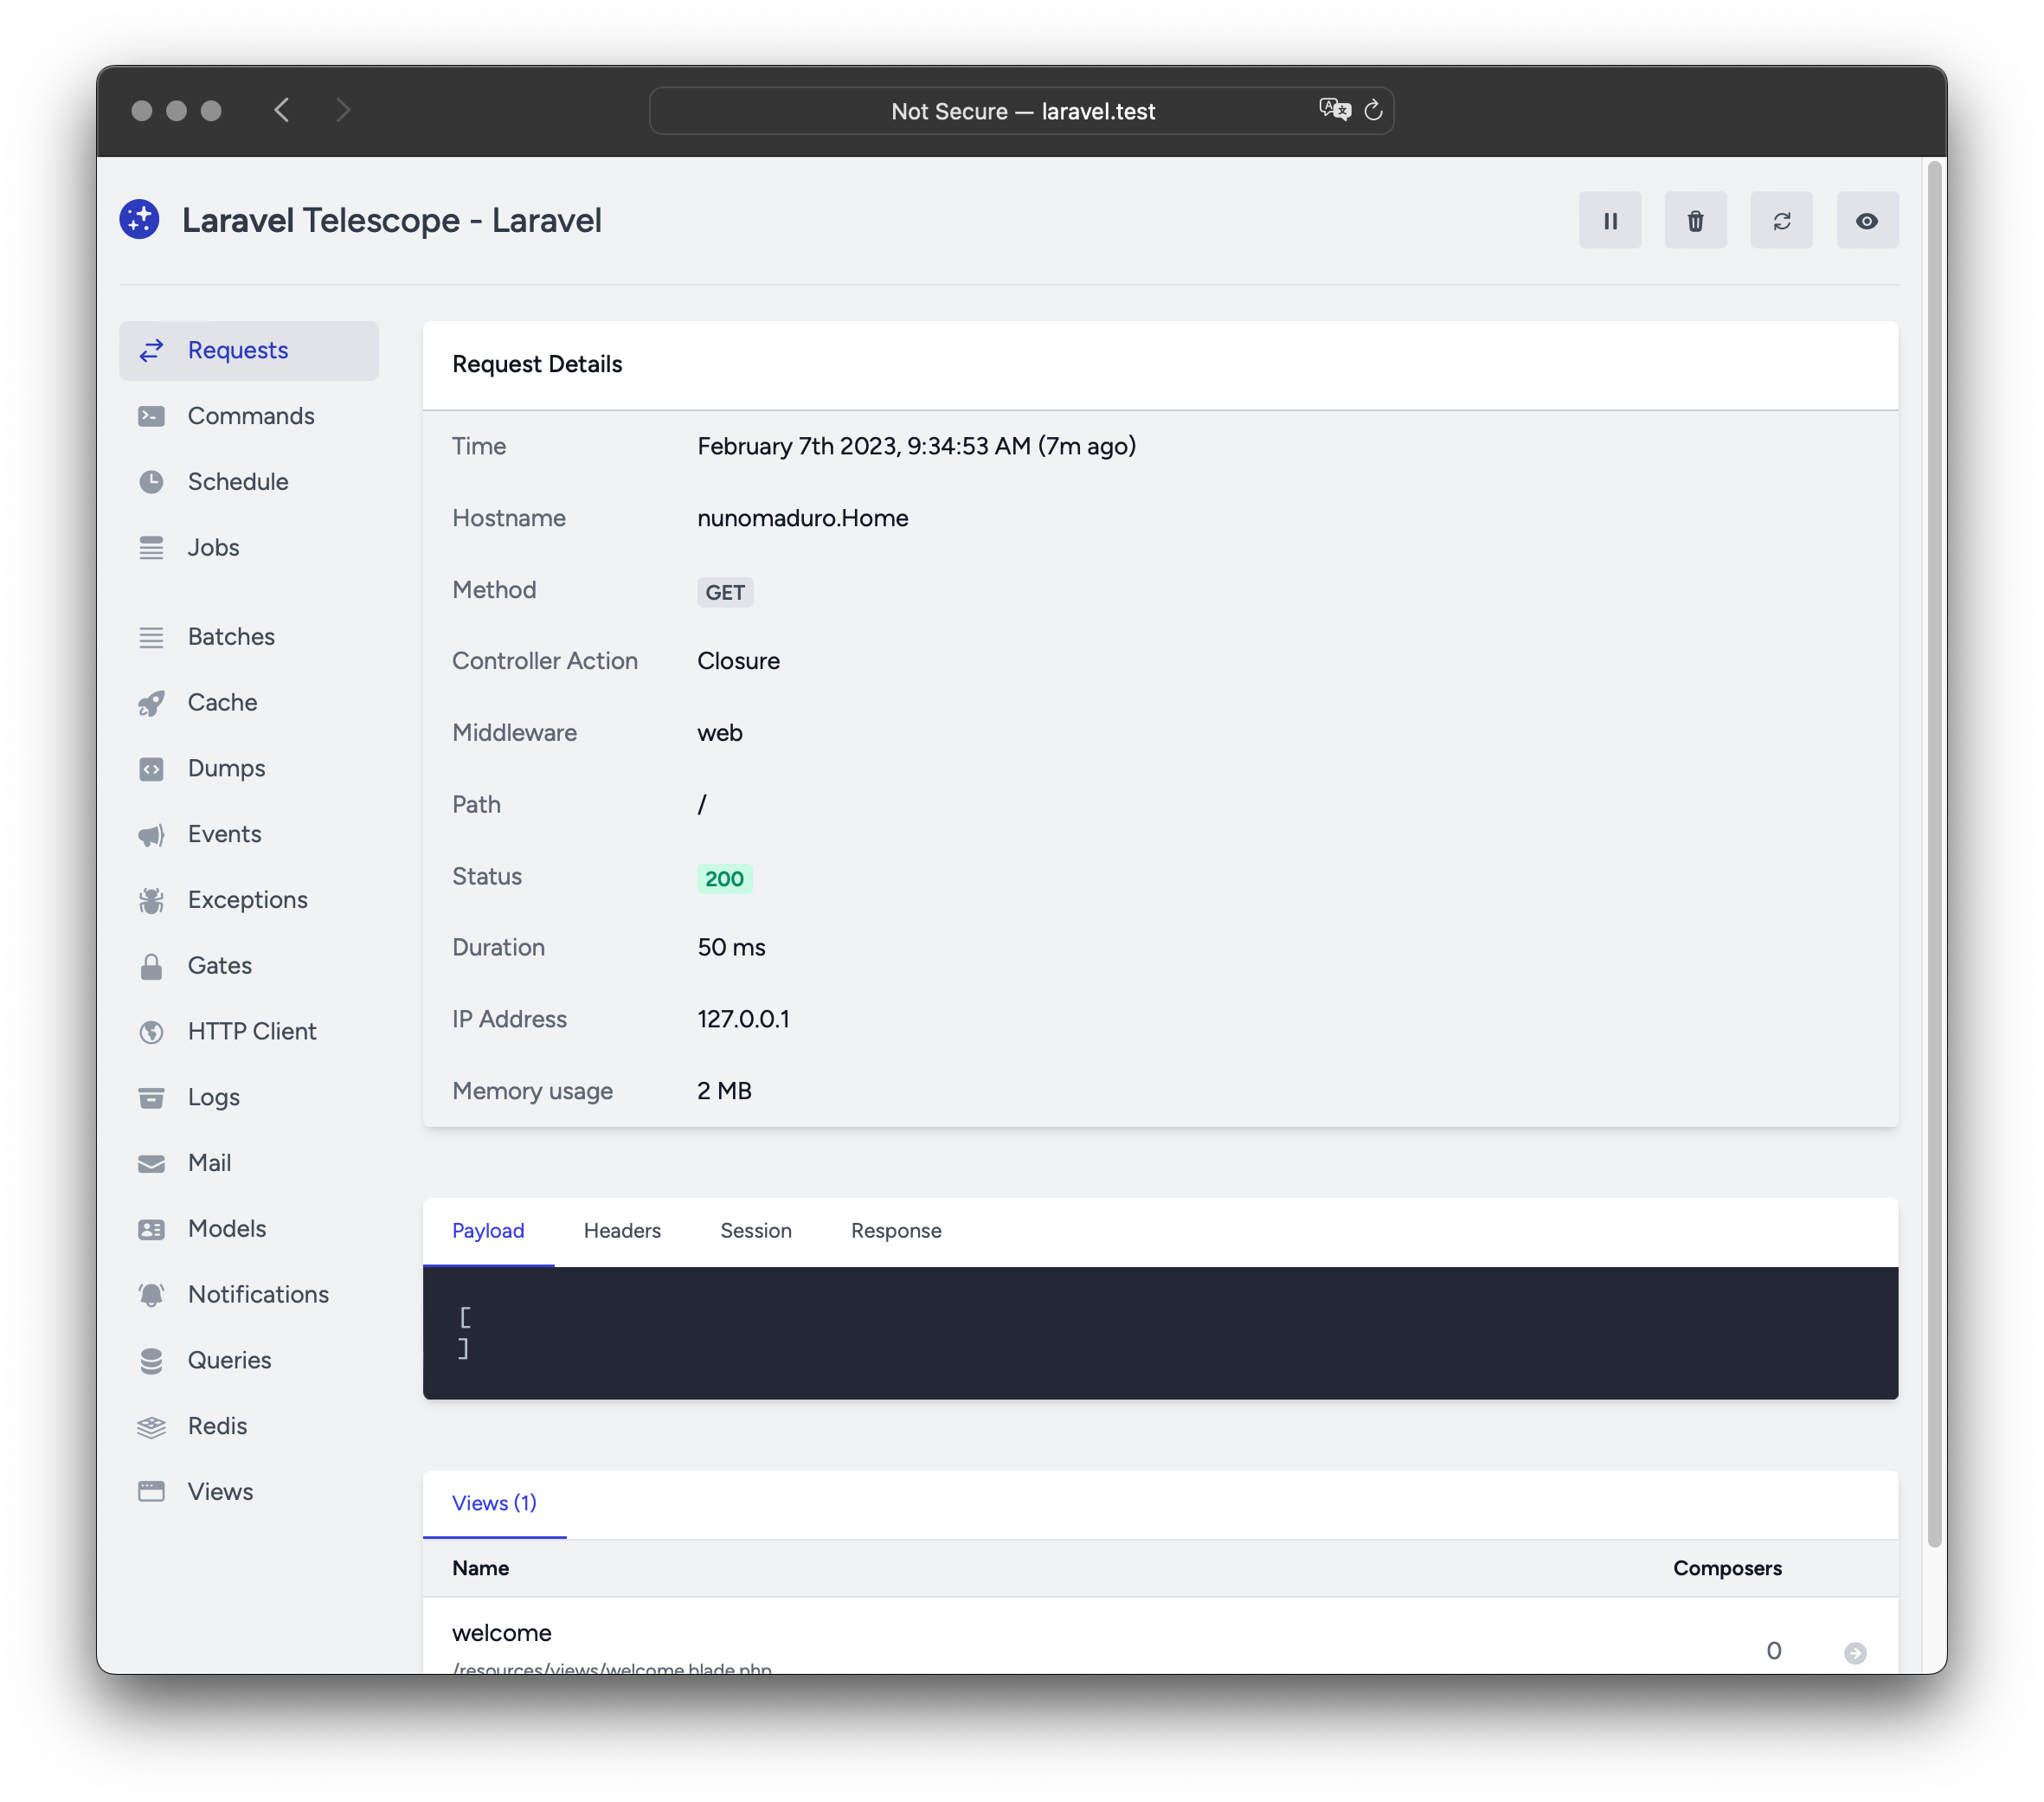
2. Laravel Telescope Link to heading
Laravel Telescope is another powerful debugging assistant. It tracks requests, logs, queries, exceptions, and more.
Installation Link to heading
Install Telescope via Composer:
composer require laravel/telescope
Publish the Telescope assets:
php artisan telescope:install
Run migrations:
php artisan migrate
Usage Link to heading
Navigate to /telescope in your application to start using Telescope.
3. Error Handling Link to heading
Laravel’s default error handling is pretty robust, but you can customize it further in the app/Exceptions/Handler.php file. Here’s an example of customizing the report method:
public function report(Exception $exception)
{
    if ($this->shouldReport($exception)) {
        // Send the exception to a third-party service
    }

    parent::report($exception);
}
Best Practices for Debugging in Laravel Link to heading
1. Log Everything Link to heading
Laravel’s logging capabilities are powerful. Use the Log facade to log messages:
use Illuminate\Support\Facades\Log;

Log::info('This is an informational message.');
Log::error('This is an error message.');
2. Use Breakpoints Link to heading
Utilize breakpoints to pause execution and inspect variables. Xdebug is a popular tool for this purpose. Configure it in your php.ini:
zend_extension=xdebug
xdebug.remote_enable=1
xdebug.remote_autostart=1
3. Isolate the Problem Link to heading
Break down your code into smaller, testable pieces. Use TDD (Test-Driven Development) to isolate and fix issues.
4. Keep Your Cool Link to heading
It’s easy to get frustrated, but remember that debugging is a skill. Patience and a methodical approach will serve you well.
Conclusion Link to heading
Debugging in Laravel doesn’t have to be a daunting task. With the right tools and techniques, you can transform it into a rewarding and educational experience. Whether you’re using Laravel Debugbar, Telescope, or custom logging, the key is to remain methodical and patient.
References:
- Barryvdh/Laravel-Debugbar: https://github.com/barryvdh/laravel-debugbar
- Laravel Telescope: https://laravel.com/docs/8.x/telescope
- Xdebug: https://xdebug.org/docs/install
Feel free to share your own debugging tips and experiences in the comments below!